Bitcoin has been trading in a tight range of $29,800 and $32,000 since the last one month. After making a temporary high of $31,814 on July 14, 2023, the prices came down to the levels of $30,000 and are now trading at $29,900 at press time.
We have used on-chain data to help you understand why Bitcoin is at current price levels.
Price History Since Last 30 Days
In the last 30 days, BTC price was somewhat constant. The last significant price rise was seen when a number of spot Bitcoin ETFs filed applications with the SEC in June 2023. That caused the prices to rise from $26,000 to $30,000 in about a couple of days.

However, BTC prices are nearly constant with the sole exception of a price rise after the Ripple Judgement. Again prices came down and are now near $30,000 levels.
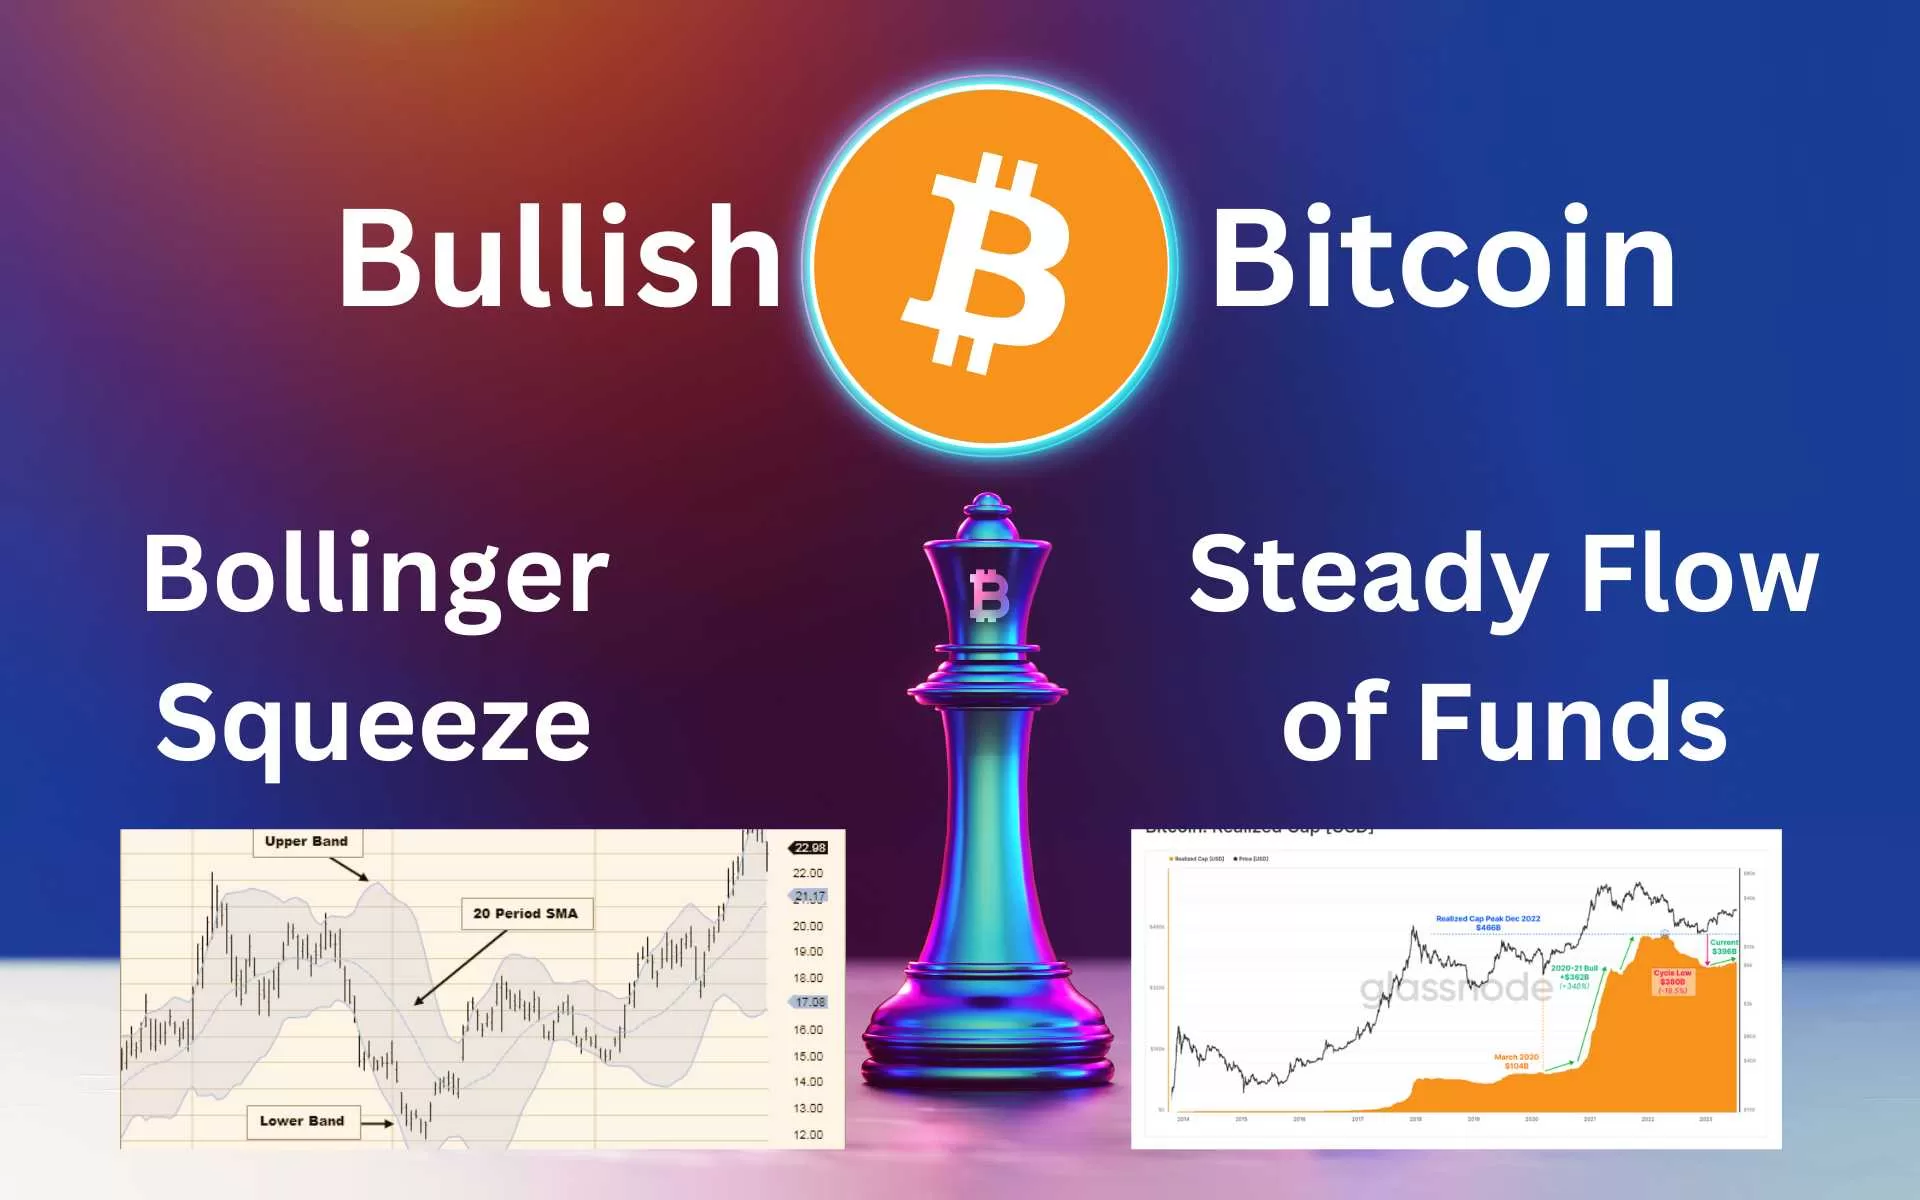
Upon a little investigation, we can see that, a steady inflow of funds are helping the markets sustain in an otherwise extreme case of Bollinger Band Squeeze.
A Look At On-Chain Factors
Steady Funds Inflow
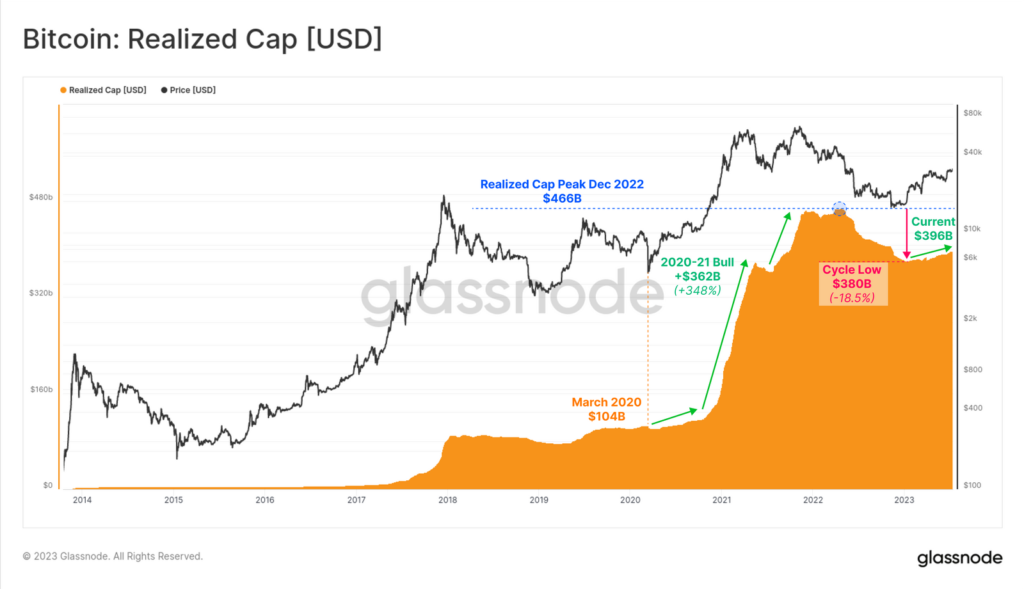
We have chosen Realized Cap to display a steady influx of funds into Bitcoin. Realized Cap is the sum total of all the realized profits and losses that were ever made in Bitcoin (on-chain transactions only).
Currently, the realized cap of Bitcoin is a little less than $400 Billion which means that till today, the total wealth creation by Bitcoin alone is net $400 Billion.
As the realized cap levels climb upwards, it shows that the profits are increasing which is only possible when people are buying at higher and higher levels.
Currently almost 71% of Bitcoin owners are in profit.

In the money means you are in profit. This happens when you have bought at prices lower than current levels. Similarly, out of the money means you are at loss and must have bought BTC at price higher than current levels.
Bollinger Band Squeeze
A Bollinger band squeeze is a scenario where extreme low volatility gives birth to a period of high volatility and the price moves rapidly in one direction.
Brief on How Bollinger Bands Work
- When the bands come close to each other in a low volatility scenario, it shows the likelihood of a sharp movement in prices.
- When the bands lines are far apart and the band is wide, it shows increase in volatility and the end of any existing price trend.
- Prices oscillate between the band lines. If prices keep touching the upper band, it signals an overbought situation and if prices keep touching the lower bands, it shows there is an oversold situation.
- Periods of low volatility (closer bands) are followed by period of higher volatility (far apart bands).
More on Bollinger Bands:
The Current Bollinger Squeeze on Bitcoin
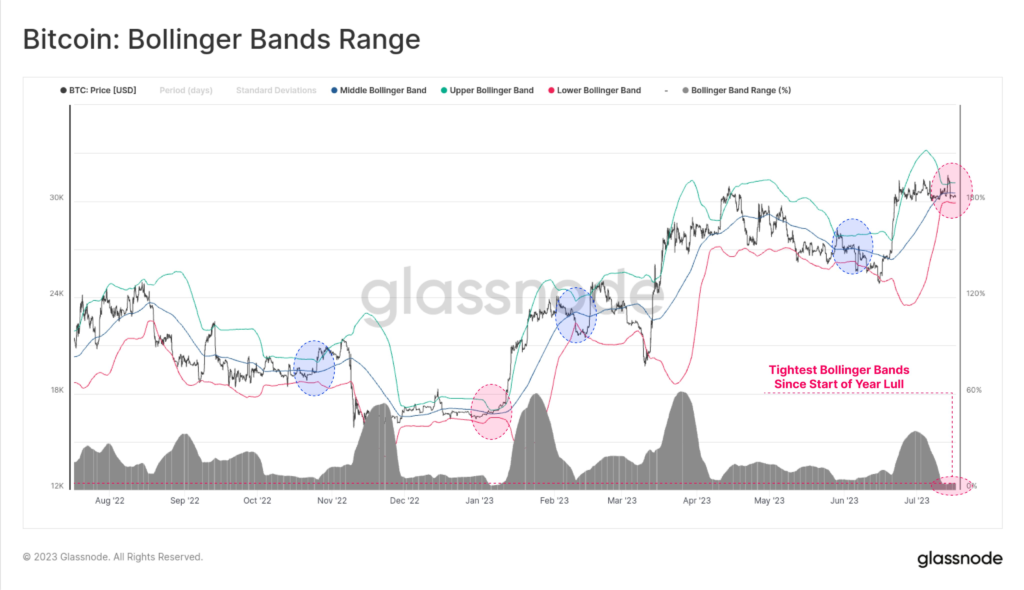
The current charts of BTC show that there is only a 4% gap between the two bands of Bollinger, which essentially constitutes a Bollinger Band Squeeze.
In such a scenario, prices can move sharply in any direction if the squeeze finalizes.
If prices break down below the lower Bollinger Bands, it shows that prices will start a fresh sell-off. Similarly, if prices break out above upper bands, it shows the possibility of a fresh rally. Either way, the movement if rapid.
Jan-Feb 2023 Squeeze
After the period of Jan-Feb 2023 when bands were witnessing low volatility, the prices experienced a fresh rally which is visible in the above chart. Prices rose from $16k to $24k within a few weeks.
Current Squeeze
The current squeeze shows that Bitcoin prices are near to the lower band which can trigger a selloff but it is still early to predict that. However, the current macroeconomic situations and the bullishness due to Bitcoin ETFs show that markets are in bullish moods.
A couple more large names’ entry into spot Bitcoin ETFs could fuel the markets to an even higher prices, possibly in the $47,000 range (high of March 2022).
Conclusion
A Bollinger squeeze into current markets could drive the prices even higher. This is because alongside institutional buying, there has been steady inflows of funds into Bitcoin as shown by the realized Mcap.